Completing an evaluation takes a substantial effort from many people, but its goal is not met until program managers and stakeholders understand its findings and act on them. Getting evaluation results and your response to the findings into the hands of both internal and external stakeholders can help support program continuation, improvements, expansion, or new initiatives.
Communicating evaluation results is much more than simply sharing reports with stakeholders and the general public. You need to interpret the information and effectively present it (e.g., through in-person meetings, webinars, posting on your website) to key audiences you have identified in your communications strategy. See the Program Design & Customer Experience – Communicate Impacts handbook for information about how to develop a strategy for communicating program impacts and benefits to key audiences to create and sustain program support and engagement.
This handbook will help guide you through the key steps to interpret and communicate evaluation results:
Understand and interpret evaluation results
Choose appropriate communications products and channels to reach your stakeholders
Determine how to present pertinent evaluation results in your communications products
Share evaluation results with program managers.
Related Handbooks
These handbooks provide more detail on designing and implementing a cohesive and balanced residential energy efficiency program.
Communicate program results to contractor partners and workforce development stakeholders.
Step by Step
As part of your overall communications strategy for how you will share information about your program’s impacts with target audiences, you will communicate pertinent results of evaluations to program staff, partners, and stakeholders through the following steps.
Review and make sure you understand the evaluation report findings. Identify any potentially confusing or misleading elements to review with your evaluator. Consider having the evaluation team present the evaluation results to you and key members of your staff. This gives you a chance to ask questions directly and make sure staff fully understand the findings. It also may be helpful to benchmark basic findings with evaluation findings from comparable programs. By comparing your program to similar programs, you will be able to judge if your program has a high, average, or low level of performance.
Define technical terms used in your communications to minimize the potential for misunderstandings. For example, you may need to explain the differences between:
Your program’s external stakeholders may include utilities, legislators, regulators, environmental and affordable housing and economic justice advocates, and the general public. Be sure to highlight the evaluation results that are most important to individual stakeholder groups. For example,
Legislators may be particularly interested in non-energy benefits—such as local economic impact, job creation, and reduced greenhouse gas emissions—that are a result of the program.
Environmental advocates will want to understand the air pollution and greenhouse gas impacts of the program.
Affordable housing and economic justice advocates will want to see how well the program is serving low- and moderate-income households.
Regulators typically require ratepayer-funded programs to report energy savings and cost-effectiveness results in terms of a specified cost-effectiveness test.
Common communications products to illustrate the impact of your program include:
When sharing results with stakeholders, work with the program’s marketing and outreach staff to consider the full range of communications channels that may be available, such as:
Social media or email lists
Content, video, infographics, and other explanations posted on websites
Traditional media, such as press releases and interviews
Participation in local events, meetings, and conferences
Webinars dedicated to the evaluation and its findings
To understand how the Better Buildings Neighborhood Program affected the residential energy efficiency market and industry, the U.S. Department of Energy worked with third-parties to conduct a comprehensive impact, process, and market effects evaluation. Complete information about the evaluation is available on the Better Buildings Neighborhood Program Accomplishments webpage and includes:
The full suite of evaluation reports, completed in June 2015:
Additional reports providing more details about program successes
Consider which communications channels are most appropriate for your intended audience(s) based on your communications strategy and your audiences’ interests and perspectives. Options and considerations for communications channels include:
Use press releases, email lists, or social media for broad messaging and to highlight program successes you want the general public to know about—for example, high average energy savings (e.g., “The average customer saves X% by participating in this program”) or major milestones (e.g., “The program is halfway toward meeting its goal to save X% energy by 20XX”)
Use your website to post the program evaluation and highlights for general public access
Use meetings, webinars, and other events to dive deeper into evaluation results with appropriate program stakeholders
Use targeted communications, such as one-on-one meetings or small group presentations, directly targeted at a relatively small audience, such as funders, elected officials, and/or potential partners.
After understanding and resolving any concerns about your program’s evaluation report, you need to identify the most appropriate results to include in your outreach to internal and external partners and stakeholders. These results will rarely be directly transferable to communications products; therefore, effective interpretation and articulation of results will be very important.
You will want to interpret areas of success and high performance, areas with opportunities for improvement, and elements that could easily be misinterpreted. When highlighting areas for improvement, identify who will take appropriate corrective action and what that action might look like. Make sure to address any internal disagreements about evaluation findings, arriving at one plan on what actions should be taken by whom.
Determine how to communicate results that are illustrative of the program’s achievements and accessible for stakeholders who may not be familiar with energy or environmental metrics, without glossing over important caveats. For example:
Non-technical audiences can typically understand energy savings better when they are expressed as a percentage of energy consumption or presented in comparison to a familiar point of reference such as a savings goal or the total consumption of a city or state.
Any format of energy savings requires clear context to make it meaningful (e.g., what is the savings goal? what was the average per home savings?).
Energy cost savings is usually more meaningful to consumer advocates than energy unit savings because the savings are expressed in terms of personal financial benefit (i.e., a lower energy bill).
Supply an appropriate baseline, such as typical pre-upgrade annual costs (e.g., $2,000 per year) compared to projected post-upgrade costs (e.g., $1,700 per year).
Lifetime cost savings are especially useful when compared to upgrade or program costs.
Because energy efficiency programs typically invest in energy efficiency improvements (measures) that will be in place for many years, compare the initial program costs to the lifetime benefits, which should be calculated and expressed as first year savings multiplied by the expected life of the measure.
For example, consider the different messages conveyed through these alternate descriptions of program impact: “Program investments of $50 million saved $6 million in first-year energy costs” and “Program investments of $50 million are projected to save more than $75 million over the lifetime of the improvements.”
These three tools from the U.S. Environmental Protection Agency (EPA) may help you express data in meaningful ways:
The Co-Benefits Risk Assessment Screening Model (COBRA) estimates the air quality, human health, and related economic co-benefits (such as energy efficiency) of initiatives that reduce air emissions.
The Greenhouse Gas Equivalencies Calculator converts greenhouse gas emissions into everyday equivalencies, such as the equivalent number of trees planted or number of cars off the road to achieve equivalent greenhouse gas emissions reductions. It can be used to help clearly communicate information about energy savings initiatives aimed at reducing greenhouse gas emissions.
Translating Your Evaluation Report for a Broader Audience
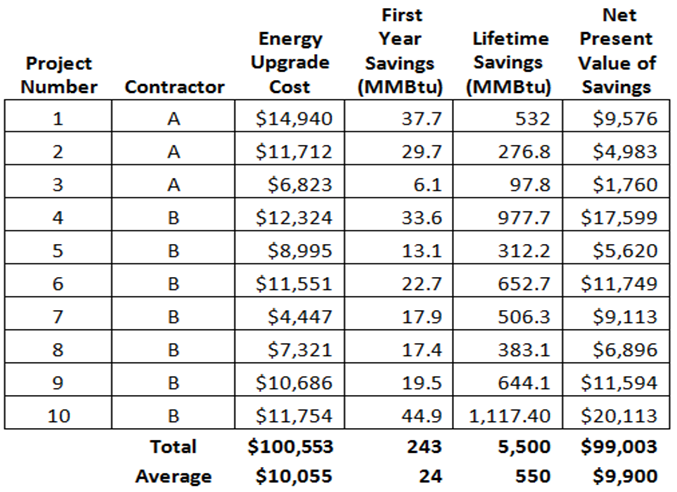
Tables such as the one below often appear in evaluation reports, showing important information that can be used to communicate program impacts. As is, though, a table like this is not suitable for most audiences or communications channels.
Illustration of Unclear Summary Data
Source: U.S. Department of Energy, 2014.
The table column headings invite confusion, misconceptions, and further questions:
Are these all the energy upgrades the program achieved? Over what period were the upgrades completed?
What constituted the upgrade cost? Does it include all costs borne by the participant? Are rebates included in the cost?
Are energy savings at the site or generation source? Are they calculated from pre-established estimates of typical savings by measure or from pre-/post-upgrade measurement of actual consumption?
How are lifetime savings projected?
How many contractors were involved in the upgrades? How many jobs were created?
What does “Net Present Value” mean in this context, and how was it calculated?
How do results compare to program goals?
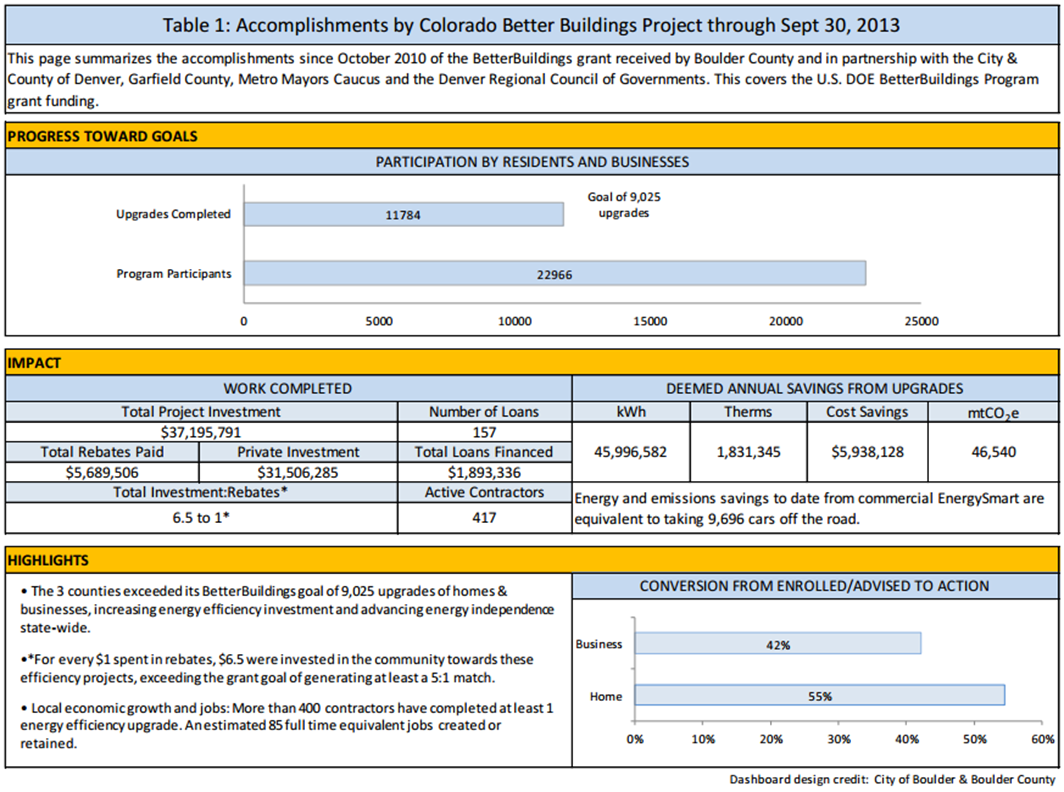
Instead of a table like the one above, your communications products should include explanatory text to answer common questions about the data presented. For example, the table below includes clearly labeled summary data from the Colorado Better Buildings Project, representing Boulder County’s EnergySmart program and the Denver Energy Challenge.
The data collection period is included in the table.
Program goals for the number of upgrades and the total investment to rebate ratio are included with the actual data, which provides a means for comparison.
Equivalent values for energy and emissions savings provide context for a general audience.
The “highlights” section provides context and additional details about the number of upgrades completed, the total investment to rebate ratio, and the number of active contractors and jobs created.
Communicating and disseminating the evaluation findings is a critical step to build support for changes based on those findings. Managers of the evaluation and evaluators should build in opportunities to share findings with key stakeholders, such as staff and program implementers, prior to the final report. Communicate the evaluation results to program staff informally while the evaluation is underway (e.g., through meetings, memos, presentations, and discussions at regularly scheduled staff meetings). By learning about preliminary results while the evaluation is still being conducted, program managers can assess and improve various aspects of the program, including its communications strategy, much sooner.
Send copies of the final evaluation report(s) or notices of their availability to all of those who can use the results. This audience is not limited to the decision-makers who are waiting for the results to inform their decisions. It could also include stakeholders in the program and other program managers who might benefit from the findings.
Develop an action plan for disseminating the evaluation findings:
Make presentations as appropriate to decision makers, program staff, implementers, and stakeholders. Be proactive about getting the results noticed and utilized. The publicity given to the findings may help the program.
Share lessons learned about the evaluation process with other program staff.
Tips for Success
In recent years, hundreds of communities have been working to promote home energy upgrades through programs such as the Better Buildings Neighborhood Program, Home Performance with ENERGY STAR, utility-sponsored programs, and others. The following tips present the top lessons these programs want to share related to this handbook. This list is not exhaustive.
Many Better Buildings Neighborhood Program partners found that program dashboards—regularly updated, easily accessed, summary reports of key metrics—helped them identify problems and monitor program progress toward their goals. Depending on the program’s goals and needs, dashboards included metrics such as energy savings, energy upgrades in progress and completed, customer satisfaction, jobs created, and cost of service delivery.
Connecticut's Neighbor to Neighbor Energy Challenge (N2N) customized their Salesforce system to display dashboards of key project data, such as contractor performance and the marketing and outreach activities of staff and volunteers. Contractors and program staff entered all the data into Salesforce. Program administrators reviewed the data on a weekly basis to ensure data quality and resolved any data quality issues with contractors. Program administrators met with outreach and contractor staff to discuss the dashboard findings and any necessary process refinements and course corrections. The program also published monthly dashboards to share data such as number of outreach events, number of leads generated, and number of upgrades completed, with state policymakers and other program partners.
Massachusetts Department of Energy Resources (MassDOER) developed a monthly dashboard that tracked the number of homes assessed, the number of home energy upgrades, and signed efficiency energy upgrade contracts. The dashboard included cumulative data and data for the past month. MassDOER used the dashboard to track the gross number of audits and upgrades, and to understand what work was “in the pipeline.” This helped MassDOER determine whether they were on track to meet project goals for assessments and upgrades. MassDOER had confidence in the data because staff reviewed the updated dashboards each month, flagged inconsistencies, and confirmed the numbers with the contractors who supplied the data, making corrections when it was necessary.
Many programs found that market research can help identify, segment, and characterize audiences to understand how to prioritize them. A comprehensive evaluation of over 140 programs across the United States found that programs had greater success when they identified specific target populations within their larger target area, then tailored their outreach to the size of the target populations. Consider prioritizing audiences based on parameters such as demographics, values, housing type, fuel source, potential for savings, common problems with homes, property ownership structure, or program entry point (e.g., remodeling opportunities). For a starting point in your targeting efforts, look online for existing market segmentation data (e.g., municipal records, Zillow, a Nielsen segmentation system called PRIZM, U.S. Census Bureau).
The ShopSmart with JEA program in Jacksonville, Florida, purchased Neilson PRIZM lifestyle segmentation data, which included demographic, consumer behavior, and geographic information, to identify, understand, and reach potential home energy upgrade customers. The data divided consumers into 66 demographically and behaviorally distinct segments. Through this market analysis, ShopSmart with JEA discovered that out of those segments, one of the most promising demographics to market its program offerings was older people without children. ShopSmart was able to use this information to market the program specifically to this demographic, as well as identify and target new demographics that had not been active in the program previously.
In Seattle, Washington, owners of oil-heated homes are ineligible for city-sponsored electric and gas utility rebates. Community Power Works purchased a mailing list from Data Marketing, Inc., that identified all owners of oil-heated homes in the city so the program could reach this previously untapped market. Given the lower efficiency and high cost of heating oil, the program recognized the energy and cost savings potential for these Seattle homeowners and engaged them in undertaking home energy upgrades by focusing outreach on the potential dollar savings that could be achieved by replacing old oil heaters. More than 700 Community Power Works customers who received the mailing then signed up for upgrades between April and August 2012. In the 11 months prior to the first mailing, only 20% of Community Power Works' upgrade projects involved oil-heated homes, and during the six months following the mailing, 50% of the homes were oil-heated. Among those homes, nearly 75% switched from oil heating to high-efficiency electric heating or high-efficiency electric heat pumps, as of mid-December 2012.
Target program messages to what customers want, not what the program does. Although residential energy efficiency programs deliver energy efficiency services, customers are more likely to respond to offers of comfort, cost savings, increased home value, health, community pride, or something else they need and value.
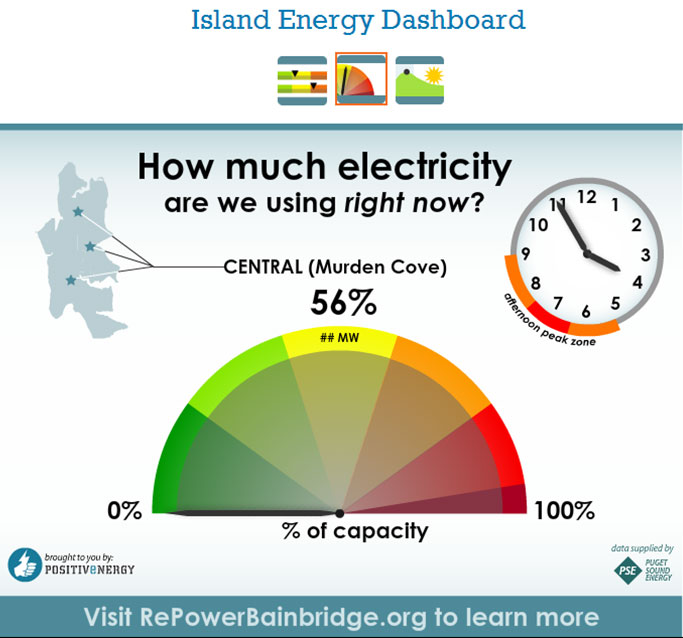
The RePower program in Washington state customized its marketing and outreach strategies to reach the environmentally conscious residents of Bainbridge Island, Washington, and Bremerton, Washington, a neighboring community with a lower income demographic. In Bainbridge, messaging focused on environmental stewardship, and an Island Energy Dashboard displayed real-time energy use in public spaces, such as local businesses and commuter ferries. Messaging geared toward Bremerton residents, meanwhile, emphasized job creation and reduced utility bills. Each location had its own community-specific website, color scheme, print advertising, online promotions, and case studies highlighting local energy champions to drive demand for residential energy upgrades.
In Florida, solar energy is in high demand, so the Solar and Energy Loan Fund (SELF) used this as a gateway to reach homeowners. Through SELF, homeowners could receive a loan for solar energy upgrades after meeting certain energy efficiency thresholds. For example, if a home energy assessment showed that the home's envelope was already sealed (or would be sealed as part of the work), a homeowner could qualify for a loan for solar panels offered by the program.
Resources
The following resources provide topical information related to this handbook. The resources include a variety of information ranging from case studies and examples to presentations and webcasts. The U.S. Department of Energy does not endorse these materials.
This report is an update of findings from three prior evaluations of Eversource's Home Energy Reports (HERs) Pilot Program. The HERs pilot program began in January 2011. The pilot program randomly selected residential customers to whom it sent reports rating their energy use, comparing it to that of their neighbors, and suggested ways for the households to save energy.
This report is the process evaluation of the Connecticut Multifamily (MF) Initiative, which leveraged the state's Home Energy Solutions (HES) and Home Energy Solutions-Income Eligible (HES-IE) programs. The objective of this process evaluation is to provide actionable recommendations about how to improve the design, delivery, and administration of the MF Initiative.
This report includes a billing analysis, process evaluation, and baseline study for the Connecticut Residential New Construction (RNC) program. It also includes the results of the process evaluation.
This report summarizes the impact analyses of National Grid's and Eversource Energy's Home Energy Report (HER) programs. The evaluation team conducted three distinct impact analyses related to these HER programs: Cohort-Specific Impact Analysis; Mapping Analysis; and Dual Treatment Analysis.
This report presents the results from a comprehensive impact and process evaluation of Efficiency Maine's Low-Income Multifamily Weatherization Program.
This report presents the results of the first‐year process and impact evaluation of Berkshire Gas' Home Energy Report (HER) program. The primary objective of the program is to provide residential households with information on their gas consumption and tips on how to save energy to prompt them to take action to reduce their natural gas usage.
This summary from a Better Buildings Residential Network peer exchange call focused on how organizations can utilize energy modeling tools like the Asset Score for multifamily buildings into their program offerings, narrow the gap between predicted and actual energy savings, and use program data to increase program productivity and quality. It features speakers from Pacific Northwest National Laboratory, American Council for an Energy-Efficient Economy, and OptiMiser.
This summary from a Better Buildings Residential Network peer exchange call focused on home energy reports to inform homeowners about their home energy use and use of customer research and segmentation to improve the results from these reports. Speakers include Opinion Dynamics and Pacific Gas & Electric.
Claire Miziolek, Northeast Energy Efficiency Partnerships, Inc.,
Joe Loper, Itron,
Abigail Daiken, U.S. Environmental Protection Agency,
Richard Counihan, Nest Labs,
Nkechi Ogbue, ecobee
Publication Date
This presentation covers control technologies, such as smart thermostats, and the opportunities they provide for program evaluation, monitoring and verification.
This webinar series is intended for state officials starting or expanding their EM&V methods for a wide range of efficiency activities including utility customer-funded programs, building energy codes, appliance and equipment standards, energy savings performance contracting, and efficiency programs that support pollution reduction goals or regulations.
This toolkit supplies evaluators doing energy efficiency evaluations in California with the latest versions of the key documents, rulings, and tools, that define, inform or control their evaluation efforts.
The Buildings Performance Database (BPD) is the largest national dataset of real building performance data, and enables users to perform statistical analysis on an anonymous dataset of hundreds of thousands of commercial and residential buildings from across the country. One of the most powerful applications of the tool is custom peer group analysis, in which users can examine specific building types and geographic areas, compare performance trends among similar buildings, identify and prioritize cost-saving energy efficiency improvements, and assess the range of likely savings from these improvements.
The Regional Evaluation, Measurement and Verification Forum (EM&V Forum) works to support use and transparency of current best practices in evaluation, measurement, verification, and reporting of energy and demand savings, costs, avoided emissions and other impacts of energy efficiency, while also advancing the development of strategies and tools to meet evolving policy needs for efficiency.
A tool that estimates the air quality, human health, and related economic co-benefits (such as energy efficiency) of initiatives that reduce air emissions.
This tool lets non-experts evaluate county-level emissions displaced at electric power plants by energy efficiency and renewable energy policies and programs.
The downloadable Self-Scoring Tool gives you the ability to score the energy efficiency efforts of your community and compare it against your peers. By answering a series of questions, you will obtain a numerical score indicative of your community’s progress toward enacting and implementing sound energy programs and policies.
Preliminary Impact Evaluation of the U.S. Department of Energy's Better Buildings Neighborhood Program
This presentation discusses the preliminary impact evaluation of the U.S. Department of Energy's Better Buildings Neighborhood Program, including program processes and what program elements are most successful in inducing market changes that will result in sustainable savings.
Preliminary Process and Market Evaluation: Better Buildings Neighborhood Program
Volume 1 of the Better Buildings Neighborhood Program Evaluation Report provides findings from a comprehensive impact, process, and market effects evaluation of the program period, spanning from September 2010 through August 2013.
Volume 2 of the Better Buildings Neighborhood Program Evaluation Report comprises a measurement and verification process, as well as billing regression analysis on projects with sufficient utility bill data, to determine gross verified savings.
New York State Energy Research and Development Authority (NYSERDA),
Tennessee Valley Authority (TVA),
Energy Right Solutions for Buisness,
Energy Right Solutions for Industry,
Efficiency Nova Scotia,
National Grid Energy Efficiency Program,
Energy Trust of Oregon,
Energy Efficiency and Renewable Energy Programs,
Enhabit,
District of Columbia Sustainable Energy Utility,
BC Hydro,
Ontario Power Authority Industrial Accelerator Program,
Elevate Energy
Among the many benefits ascribed to energy efficiency is the fact that it can help create jobs. Although this is often used to motivate investments in efficiency programs, verifying job creation benefits is more complicated than it might seem at first. This paper identifies some of the issues that contribute to a lack of consistency in attempts to verify efficiency-related job creation. It then proposes an analytically rigorous and tractable framework for program evaluators to use in future assessments.
This policy brief presents a program typology and standardized data metrics for assessing energy efficiency program characteristics, costs, and impacts. Based on a review of nationwide regulatory filings, the research serves as part of an effort to analyze the cost per unit of savings for utility customer-funded energy efficiency programs. The paper discusses the program categories and definitions, which are based primarily on review of several years of annual energy efficiency reports from 108 program administrators in 31 states for approximately 1,900 unique programs.
New York State Energy Research and Development Authority (NYSERDA)
This guide provides an introduction to the key issues, practices, and steps for calculating energy savings, avoided emissions, and other non-energy impacts associated with energy efficiency programs.
This interim evaluation report examines the design, delivery, and market effects of each of the Southeast Energy Efficiency Alliance's (SEEA) thirteen sub-grantee programs and identifies opportunities to increase each program's success, and quantifies and verifies the energy savings achieved through the programs' funded home energy improvements and the cost-effectiveness of those savings.
This report provides guidance and recommendations to help residential energy efficiency programs to more accurately estimate energy savings. It identifies steps program managers can take to ensure precise savings estimates, apply impact estimates over time, and account for and avoid potential double counting of savings.